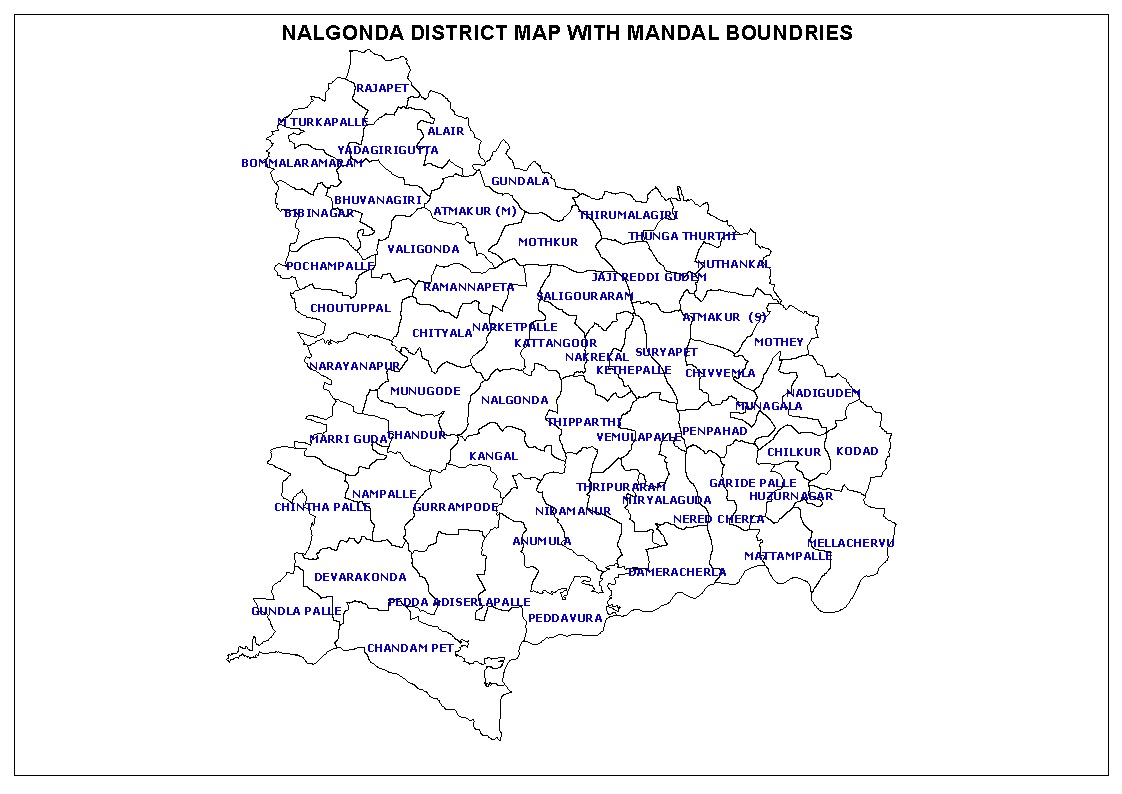
NALGONDA DISTRICT MAP
Nalgonda District at Glance |
|---|
1. Demographic Particulars
2. HEALTH 2015
3. Seasonal Conditions 2014-15
4. Agriculture 2014-15
5. Livestock Census - 2012
6. State Income 2014-15
7. Industry - 2009-10
8. Power Consumption-(Provisional) (Low Tension)
9. Transport and Communications
10. Banks As on March 2015-16
11. Education 2014-15
| Sl. No. | Item | Unit | Nalgonda |
| 1 | 2 | 3 | 4 |
|---|---|---|---|
| Demographic Particulars | |||
| 1 | Area | Sq.Kms | 14,240 |
| 2 | Population as per 2011 Census | ||
| a) Total population | No. | 34,88,809 | |
| b) Males | " | 17,59,772 | |
| c) Females | " | 17,29,037 | |
| Percentage decadal growth rate of population | |||
| a) 1991-01 | % | 13.88 | |
| b) 2001-11 | % | 7.41 | |
| Sex- Ratio (Number of Females per 1000 Males) |
|||
| a) 2001 | No. | 966 | |
| b) 2011 | " | 983 | |
| Population density per sq. km. |
|||
| a) 2001 | No. | 228 | |
| b) 2011 | " | 245 | |
| Population(0-6 years) | |||
| a) Total population | No. | 371735 | |
| b) Males | " | 193266 | |
| c) Females | " | 178469 | |
| Literates | |||
| Male | No. | 1160757 | |
| Female | " | 840262 | |
| Total | " | 2001019 | |
| Literacy Rate | |||
| Male | % | 74.10 | |
| Female | " | 54.19 | |
| Total | " | 64.20 | |
| Urban Population | " | 662507 | |
| Urban Population as % to Total Population | % | 18.99 | |
| Rural Population | No. | 2826302 | |
| Rural Population as % to Total Population | % | 81.01 | |
| No.of Households | " | 875939 | |
| Scheduled Caste Population | " | 637385 | |
| Scheduled Tribe Population | " | 394279 | |
| 3 | Population (As per 2001 Census) | ||
| a)Total Population | No | 3247982 | |
| b)Urban Population | " | 432678 | |
| c)Urban Population as % to Total Population | % | 13.32 | |
| d)Rural Population | No. | 2815304 | |
| e)Rural Population as % to Total Population | % | 86.68 | |
| f) Population(0-6 years) | No. | 455958 | |
| g)No.of Households | " | 723015 | |
| Density of Population (per sq.km) | " | 229 | |
| Scheduled Caste Population | " | 575788 | |
| Scheduled Tribe Population | " | 342676 | |
| Literates | |||
| Male | No | 981875 | |
| Female | " | 613768 | |
| Total | " | 1595643 | |
| Literacy Rate | |||
| Male | % | 69.2 | |
| Female | " | 44.7 | |
| Total | " | 57.2 | |
| Classification of Workers (As per 2011 Census) | |||
| (A) Total Workers (i+ii) | No | 1741693 | |
| i ) Main Workers | " | 1493419 | |
| ii)Marginal Workers | " | 248274 | |
| a) Cultivators | " | 325224 | |
| b)Agriculture Labourers | " | 863131 | |
| c)Household Industry | " | 45124 | |
| d)Other Workers | " | 508214 | |
| (B) Non-Workers | " | 1747116 | |
| 4 | Administrative Divisions | ||
| Revenue Divisions | " | 5 | |
| Towns | " | 17 | |
| Revenue Mandals | " | 59 | |
| Mandal Parishads | " | 59 | |
| Gram Panchayats | " | 1176 | |
| Revenue Villages as per 2001 Census | " | 1135 | |
| a)Inhabited Villages | " | 1107 | |
| b)Un-inhabited Villages | " | 28 | |
| Sl. No. | Item | Unit | Nalgonda |
| 1 | 2 | 3 | 4 |
|---|---|---|---|
| HEALTH 2015 | |||
| Allopathic | |||
| a)Hospitals | No. | 12 | |
| b)Primary Health centres | " | 74 | |
| c)Hospital beds | " | 1454 | |
| d)Dispensaries | " | 4 | |
| e)Doctors | |||
| Regular | No. | 222 | |
| Contract | " | 30 | |
| Ayurveda | |||
| a)Dispensaries | No. | 46 | |
| b)Doctors | " | 34 | |
| Homoeopathy | |||
| a)Dispensaries | No. | 21 | |
| b)Doctors | " | 12 | |
| Unani | |||
| a)Dispensaries | No. | 19 | |
| b)Doctors | " | 14 | |
| Sl. No. | Item | Unit | Nalgonda |
| 1 | 2 | 3 | 4 |
|---|---|---|---|
| Seasonal Conditions 2014-15 | |||
| 6 | Seasonal Conditions | ||
| a)Normal Rainfall (2014-15) | mms | 752.6 | |
| b)Actual Rainfall (2014-15) | " | 478.5 | |
| c) Percentage Deviation | % | -36 | |
| Sl. No. | Item | Unit | Nalgonda |
| 1 | 2 | 3 | 4 |
|---|---|---|---|
| Agriculture 2014-15 | |||
| 7 | Agriculture 2014-15 | ||
| Gross Cropped Area | Hects. | 729918 | |
| Net Cropped Area | " | 583174 | |
| a) Gross Irrigated Area | " | 386013 | |
| b) Gross Area Irrigated as % to total cropped area | % | 52.9 | |
| Net Irrigated Area | Hects. | 253802 | |
| Area under Principal Crops 2014-15 | |||
| a) Rice | Hects. | 323375 | |
| b) Jowar | " | 1892 | |
| c) Bajra | " | 41 | |
| d)Maize | " | 3846 | |
| e) Red Gram | " | 15689 | |
| f)Bengal gram | " | 189 | |
| g)Black Gram(Mash) | " | 519 | |
| h)Greeen Gram | " | 8970 | |
| i)Horse Gram | " | 634 | |
| j)Chillies | " | 4328 | |
| k)Onions | " | 1 | |
| l) Groundnut | " | 14372 | |
| m)Castor | " | 487 | |
| n) Sesamum | " | 608 | |
| o)sunflower | " | 56 | |
| p)Cashewnut (Bearing Area) | " | 0 | |
| q) Cotton | " | 307792 | |
| r)Tobbaco | " | 101 | |
| s) Sugarcane (Gur) | " | 743 | |
| t) Coconut (Bearing Area) | " | 0 | |
| u) Turmeric | " | 1 | |
| v)Banana | " | 39 | |
| w)Mangoes(Bearing Area) | " | 7997 | |
| Production in tonnes | |||
| a) Rice | Tonnes | 1041359 | |
| b) Jowar | " | 643 | |
| c) Bajra | " | 17 | |
| d)Maize | " | 7344 | |
| e) Red Gram | " | 7483 | |
| f)Bengal gram | " | 259 | |
| g)Black Gram | " | 211 | |
| h)Greeen Gram | " | 2648 | |
| i)Horse Gram | " | 242 | |
| j)Chillies | " | 13370 | |
| k)Onions | " | 27 | |
| l) Groundnut | " | 17942 | |
| m)Castor | " | 86 | |
| n) Sesamum | " | 57 | |
| o)Sunflower | " | 80 | |
| p)Cashewnut | " | 0 | |
| q) Cotton (Lint) | Bales | 505141 | |
| s)Tobbaco | Tonnes | 392 | |
| t) Sugarcane(Gur) | " | 6197 | |
| u) Coconut ('000) | No. of Nuts | ||
| v) Turmeric | Tonnes | 5 | |
| w)Banana | " | 1645 | |
| x)Mangoes | " | 126832 | |
| Sl. No. | Item | Unit | Nalgonda |
| 1 | 2 | 3 | 4 |
|---|---|---|---|
| Livestock Census - 2012 | |||
| 8 | Livestock Census - 2012 | ||
| Livestock Population (with out dogs) | No | 37,54,566 | |
| Veterinary Institutions as on 2014-15 | 284 | ||
| Veterinary Hospitals | No. | 13 | |
| Livestock Supervisory Units (Veternary Despensaries) | " | 128 | |
| Rural Livestock Units | " | 141 | |
| Sl. No. | Item | Unit | Nalgonda |
| 1 | 2 | 3 | 4 |
|---|---|---|---|
| State Income 2014-15 | |||
| 1 | Gross District Domestic Product at current prices for the year 2014-15(FRE) | Rs.in Lakhs | 4507189 |
| 2 | Net District Domestic Product at current prices for the year 2014-15(FRE) | Rs.in Lakhs | 4075133 |
| 3 | Per capita Income at current prices for the year 2014-15(FRE) | Rupees. | 114353 |
| 4 | Gross District Domestic Product at constant (2011-2012) prices for the year 2014-15 (FRE) | Rs.in Lakhs | 3,741,000 |
| 5 | Net District Domestic Product at constant (2011-2012) prices for the year 2014-15 (FRE) | Rs.in Lakhs | 3363400 |
| 6 | Per capita Income at constant (2011-2012) prices for the year 2014-15 (FRE) | Rs. | 94381 |
| Sl. No. | Item | Unit | Nalgonda |
| 1 | 2 | 3 | 4 |
|---|---|---|---|
| Industry - 2009-10 | |||
| 10 | Industry - 2009-10 | ||
| a)No.of factories | No. | 678 | |
| b)Employees | " | 45815 | |
| c) Value of Output | Rs. in Lakhs | 1942592 | |
| d)Value of Input | " | 1276867 | |
| e)Net value added | " | 583614 | |
| f)Total emoluments | " | 76042 | |
| Sl. No. | Item | Unit | Nalgonda |
| 1 | 2 | 3 | 4 |
|---|---|---|---|
| Power Consumption-(Provisional) (Low Tension) | |||
| 11 | Power Consumption-2014-15(Provisional) (Low Tension) | ||
| a)Domestic | in MkWh | 30,35,031 | |
| b)Commercial (Non-Domestic) | " | 1,19,305 | |
| c)Industry | 1,89,650 | ||
| d)Agriculture | " | 16,12,507 | |
| Sl. No. | Item | Unit | Nalgonda |
| 1 | 2 | 3 | 4 |
|---|---|---|---|
| Transport and Communications | |||
| 12 | Transport and Communications | ||
| Length of roads as on 2014-15 | Kms | 14,563.35 | |
| a) Under R&B Department | " | 3,508.90 | |
| b) Zilla Parishad and Mandal Parishad (Panchayat Raj) | " | 10,678.99 | |
| c) National Highway | " | 375.46 | |
| Road Density | per '000 Sq.Kms. | ||
| Motor Vehicles(on Road) | No. | 4,63,058 | |
| Vehicle density | per Sq.Km. | ||
| Telephone connections As on 31st 2014-15) | No. | 23,203 | |
| Sl. No. | Item | Unit | Nalgonda |
| 1 | 2 | 3 | 4 |
|---|---|---|---|
| Banks As on March 2015-16 | |||
| 13 | Banks As on March 2015 | ||
| Bank Offices | " | 379 | |
| Average Population per Bank (in '000) | " | 9.00 | |
| Credit Deposit Ratio | % | 65.30 | |
| Sl. No. | Item | Unit | Nalgonda |
| 1 | 2 | 3 | 4 |
|---|---|---|---|
| Education 2014-15 | |||
| 14 | Education2014-2015 | ||
| No.of Institutions | No. | 4668 | |
| @ | Schools (I - V) | ||
| No.of Schools | No. | 2,817 | |
| Enrolment | " | 231289 | |
| Teachers VII | " | 8,688 | |
| @ | Schools ( I - II / VIII) | ||
| No.of Schools | No. | 629 | |
| Enrolment | " | 95,176 | |
| Teachers | " | 4,087 | |
| @ | Schools (I - XII) | ||
| No.of Schools | No. | 13 | |
| Enrolment | " | 7778 | |
| Teachers | " | 179 | |
| @ | Schools (VI - XII) | ||
| No.of Institutions school | No. | 34 | |
| Enrolment | " | 13,841 | |
| Teachers | " | 538 | |
| @ | Schools (I - X) | ||
| No.of Institutions | No. | 42 | |
| Enrolment | " | 16,881 | |
| Teachers | " | 413 | |
| @ | Schools (VI - X) | ||
| No.of Institutions | No. | 1133 | |
| Enrolment | " | 215,841 | |
| Teachers | " | 9,998 | |
| @ | Junior Colleges | ||
| No.of Colleges | No. | 303 | |
| Enrolment | " | 37602 | |
| Teachers | " | 3102 | |
| 15 | Tourist Arrivals As on 31st December, 2015 | No. | |
| Indians | " | 73,20,908 | |
| Foreigners | " | 500 | |